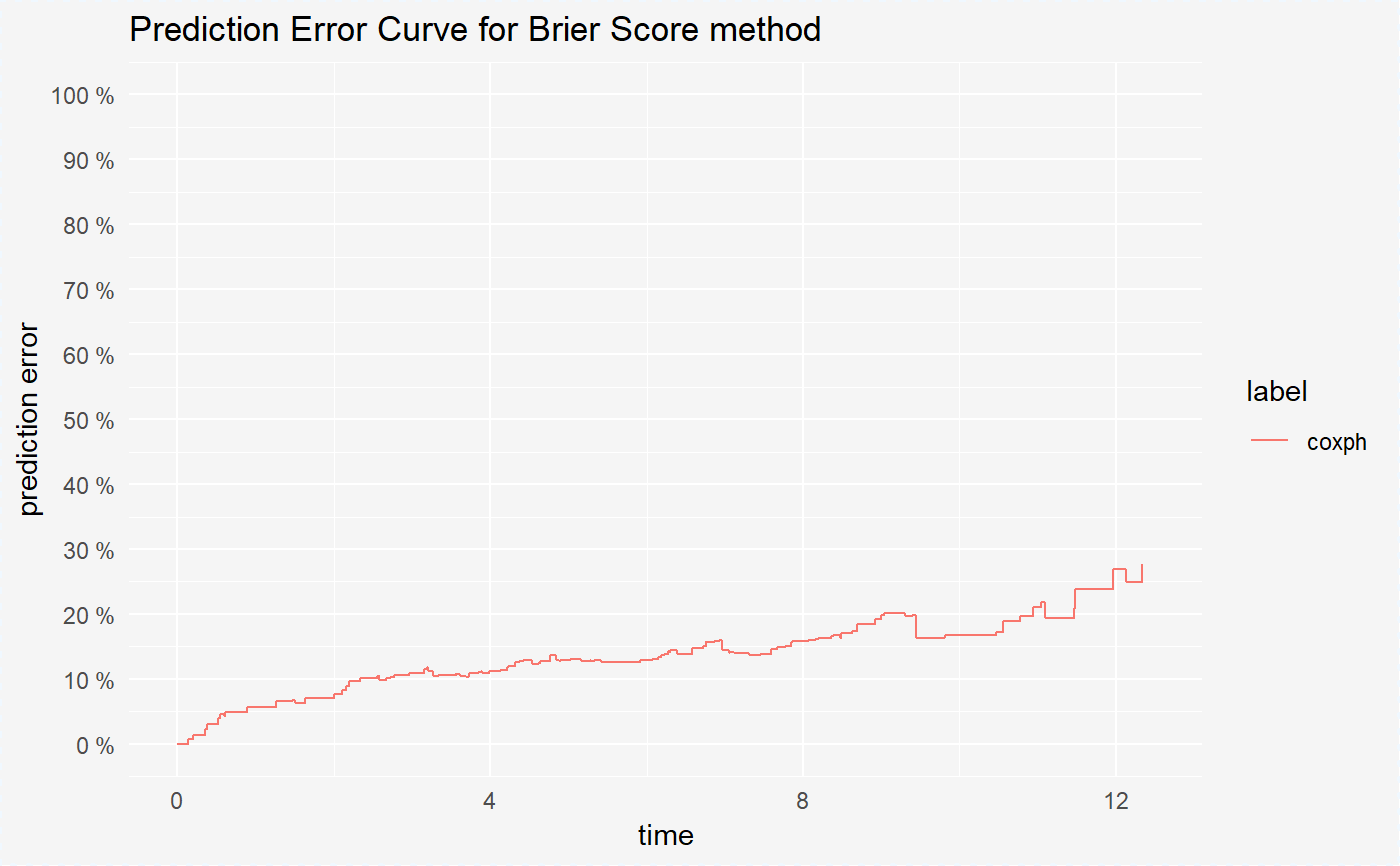
Plot for surv_model_performance object
Function plot for surv_model_performance object.
# S3 method for surv_model_performance_explainer
plot(x, ...)
Arguments
| x | object of class "surv_model_performance" |
|---|---|
| ... | other arguments |
Examples
library(survxai) library(rms) data("pbcTest") data("pbcTrain") predict_times <- function(model, data, times){ prob <- rms::survest(model, data, times = times)$surv return(prob) } cph_model <- cph(Surv(years, status)~., data=pbcTrain, surv=TRUE, x = TRUE, y=TRUE) surve_cph <- explain(model = cph_model, data = pbcTest[,-c(1,5)], y = Surv(pbcTest$years, pbcTest$status), predict_function = predict_times) mp_cph <- model_performance(surve_cph, data = pbcTest)#>plot(mp_cph)#> Warning: Removed 2 rows containing missing values (geom_path).