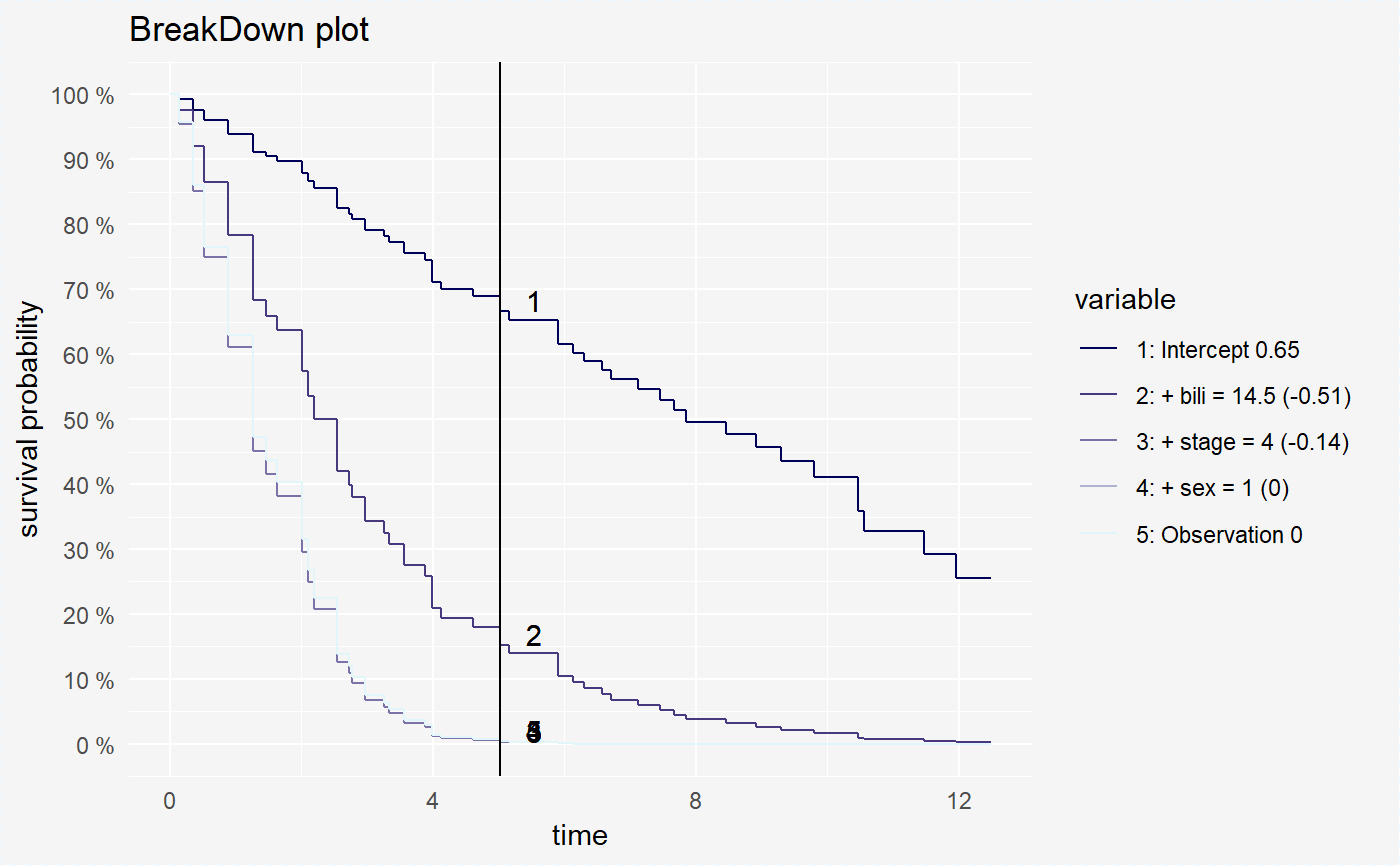
Plot for surv_breakdown object
Function plot for surv_breakdown object visualise estimated survival curve of mean probabilities in chosen time points.
# S3 method for surv_prediction_breakdown_explainer
plot(x, ...,
  numerate = TRUE, lines = TRUE, lines_type = 1,
  lines_col = "black", scale_col = c("#010059", "#e0f6fb"))
Arguments
| x | an object of class "surv_prediction_breakdown_explainer" |
|---|---|
| ... | other arguments, for example additional object of class "surv_prediction_breakdown_explainer" |
| numerate | logical; indicating whether we want to number curves |
| lines | logical; indicating whether we want to add lines on chosen time point or probability |
| lines_type | a type of line; see http://sape.inf.usi.ch/quick-reference/ggplot2/linetype |
| lines_col | a color of line |
| scale_col | a vector containig two colors for gradient scale in legend |
Examples
library(survxai)
library(rms)
data("pbcTest")
data("pbcTrain")
predict_times <- function(model, data, times){
                  prob <- rms::survest(model, data, times = times)$surv
                  return(prob)
                  }
cph_model <- cph(Surv(years, status)~., data=pbcTrain, surv=TRUE, x = TRUE, y=TRUE)
surve_cph <- explain(model = cph_model, data = pbcTest[,-c(1,5)],
                    y = Surv(pbcTest$years, pbcTest$status), predict_function = predict_times)
broken_prediction <- prediction_breakdown(surve_cph, pbc[1,-c(1,2)])
plot(broken_prediction)