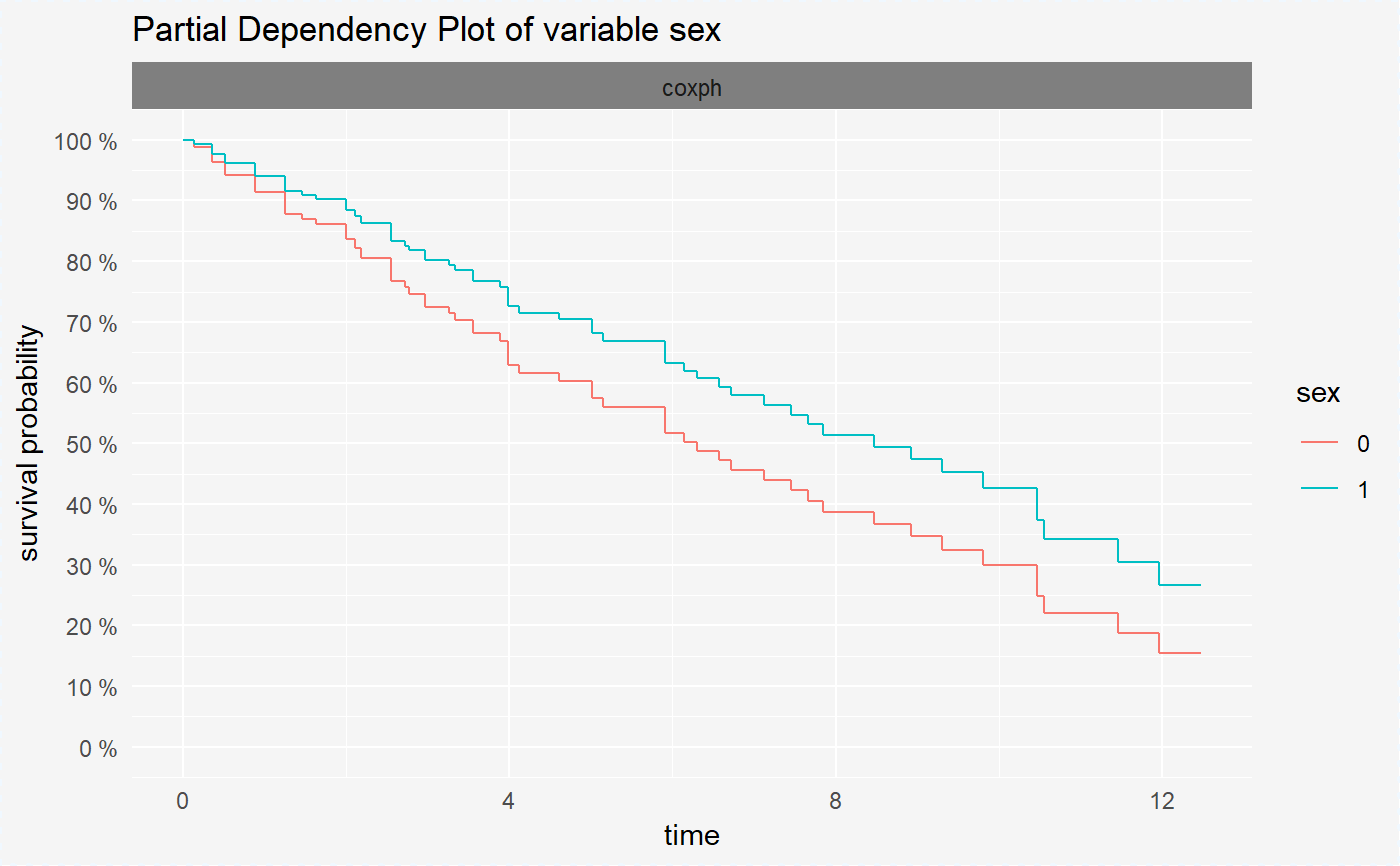
Plot for surv_variable_response object
Function plot for surv_variable_response object shows the expected output condition on a selected variable.
# S3 method for surv_variable_response_explainer
plot(x, ..., split = "model")
Arguments
| x | an object of class "surv_variable_response" |
|---|---|
| ... | other arguments |
| split | a character, either "model" or "variable"; sets the variable for faceting |
Examples
library(survxai)
library(rms)
data("pbcTest")
data("pbcTrain")
predict_times <- function(model, data, times){
                  prob <- rms::survest(model, data, times = times)$surv
                  return(prob)
                  }
cph_model <- cph(Surv(years, status)~., data=pbcTrain, surv=TRUE, x = TRUE, y=TRUE)
surve_cph <- explain(model = cph_model, data = pbcTest[,-c(1,5)],
             y = Surv(pbcTest$years, pbcTest$status), predict_function = predict_times)
svr_cph <- variable_response(surve_cph, "sex")
plot(svr_cph)